Tutorial 4: Hemodynamics and Post-Processing
Goal: Compute clinically relevant hemodynamic metrics from pre-computed CFD results and understand their clinical significance.
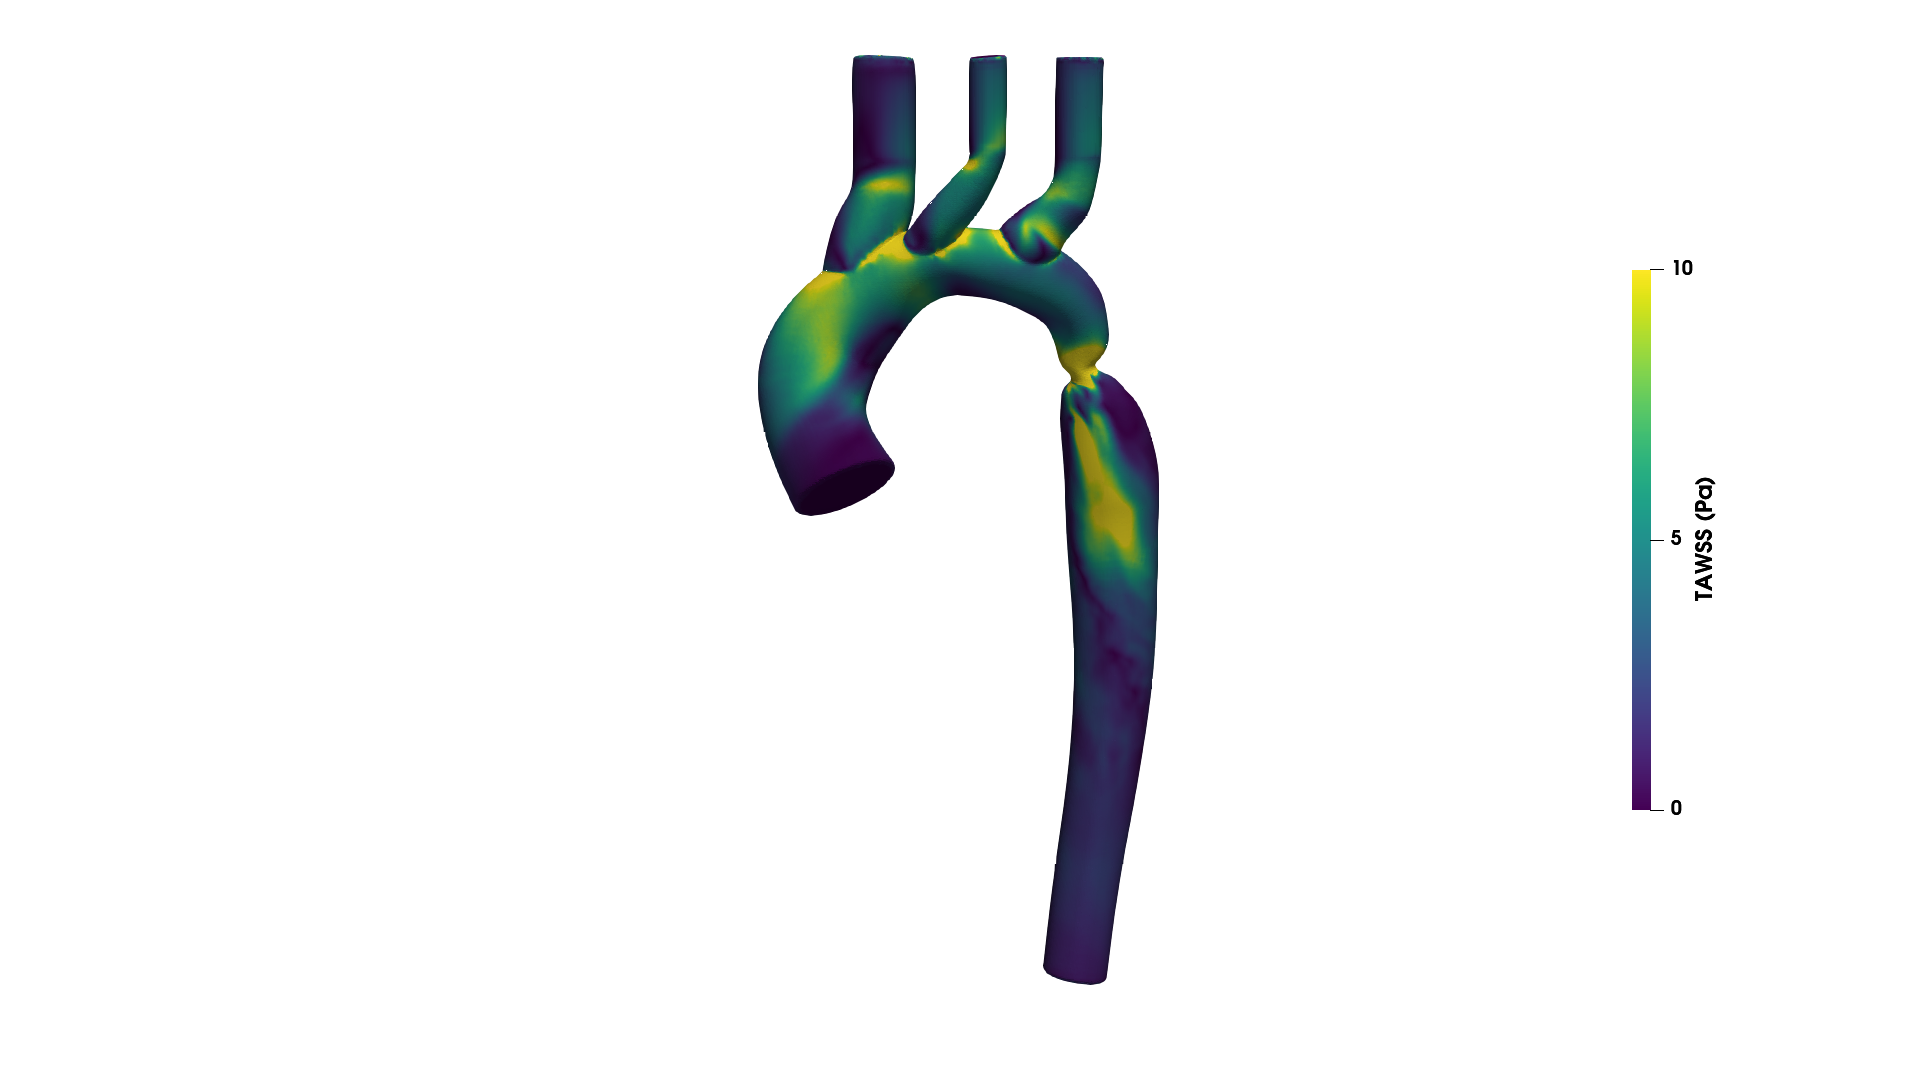 Wall shear stress distribution on a branched aorta at peak systole. High WSS (yellow) at the coarctation jet impingement; low WSS (blue) in recirculation zones — regions of potential clinical concern.
Hands-On Exercise
Download: exercise_g3_postprocess.tar.gz (5.3 MB) Time: ~10 seconds | Requires: Python 3 + numpy (no simulation needed)
Prerequisites
- Completed Tutorials 1--3 (mesh generation, boundary conditions, solver execution)
- Python environment with AortaCFD dependencies installed
- ParaView 5.10 or later available for visualisation (optional)
Learning Objectives
By the end of this tutorial you will be able to:
- Define TAWSS, OSI, and RRT mathematically and explain their clinical relevance.
- Run the AortaCFD post-processing pipeline on pre-computed results.
- Interpret a QoI summary report and identify regions of clinical concern.
- Explain the clinical significance of pressure drop in aortic coarctation.
- Use percentile-based descriptors rather than maximum values for publication.
What Are Hemodynamic Metrics?
Wall shear stress (WSS) is the tangential force per unit area exerted by flowing blood on the vessel wall. In cardiovascular physiology, it is not the instantaneous WSS that determines disease progression, but rather the pattern of WSS over the cardiac cycle. Three derived quantities capture different aspects of the WSS environment:
| Metric | Captures | Clinical Relevance |
|---|---|---|
| TAWSS | Time-averaged shear magnitude | Low values associated with atherosclerosis |
| OSI | Directional oscillation of shear | High values indicate disturbed, multidirectional flow |
| RRT | Combined effect of low shear and oscillation | Surrogate for near-wall particle residence time |
These metrics were introduced in the 1990s and have become the standard hemodynamic descriptors in computational cardiovascular research. Their biological significance arises from the mechanotransduction response of endothelial cells, which sense and respond to the mechanical environment at the vessel wall He & Ku 1996; Himburg 2004.
Time-Averaged Wall Shear Stress (TAWSS)
Drag the threshold slider to explore how much of the vessel wall falls into different WSS ranges. Data from the G3 pulsatile simulation:
Definition
TAWSS is the time-averaged magnitude of the wall shear stress vector over one cardiac cycle:
where \(T\) is the cardiac cycle period and \(\boldsymbol{\tau}_w(t)\) is the instantaneous WSS vector at a point on the wall.
Clinical Significance
Low TAWSS is associated with atherogenesis through several biological mechanisms: reduced endothelial nitric oxide production, increased permeability to lipoproteins, and enhanced monocyte adhesion Malek 1999. The landmark work of He and Ku He & Ku 1996 established that regions of low and oscillatory WSS correlate with sites of intimal thickening and plaque formation.
| TAWSS Range | Clinical Interpretation |
|---|---|
| < 0.4 Pa | Atherogenic; associated with plaque formation and endothelial dysfunction |
| 1--3 Pa | Normal physiological range for healthy large arteries |
| 3--7 Pa | Elevated; typical at branch ostia and moderate stenoses |
| > 40 Pa | Risk of endothelial erosion and mechanical damage |
Units
TAWSS is reported in Pascals (Pa) in the hemodynamics report. OpenFOAM internally computes WSS in kinematic units (m\(^2\)/s\(^2\)); AortaCFD multiplies by density (\(\rho\) = 1060 kg/m\(^3\)) during post-processing to produce physical units.
Oscillatory Shear Index (OSI)
Definition
OSI quantifies the degree of directional change in the WSS vector during the cardiac cycle He & Ku 1996:
The numerator of the fraction is the magnitude of the mean WSS vector (directional average), while the denominator is the mean WSS magnitude (TAWSS). When flow is purely unidirectional, these are equal, yielding OSI = 0. When forward and reverse shear components cancel exactly, OSI reaches its maximum of 0.5.
Clinical Significance
| OSI Range | Flow Character | Clinical Implication |
|---|---|---|
| < 0.1 | Predominantly unidirectional | Normal, healthy flow environment |
| 0.1--0.2 | Moderate oscillation | Mildly disturbed; monitor |
| > 0.2 | Highly oscillatory | Disturbed flow; potential endothelial dysfunction He & Ku 1996 |
OSI Masking
In regions where TAWSS approaches zero, even tiny numerical perturbations in the WSS vector direction produce spuriously large OSI values. AortaCFD applies a masking threshold (TAWSS > 0.5 Pa) and reports the masked mean OSI to exclude these numerically unreliable regions Les 2010.
Relative Residence Time (RRT)
Definition
RRT combines TAWSS and OSI into a single metric that serves as a surrogate for the residence time of blood constituents near the vessel wall Himburg 2004:
Physical Interpretation
High RRT indicates that particles near the wall remain in the vicinity for a prolonged period. This promotes atherogenic processes: lipid accumulation, platelet activation, and inflammatory cell adhesion. RRT is elevated in regions where TAWSS is low and OSI is high --- precisely the hemodynamic environment most conducive to plaque formation.
| RRT Range | Interpretation |
|---|---|
| < 5 Pa\(^{-1}\) | Normal residence time |
| 5--10 Pa\(^{-1}\) | Moderately elevated |
| > 10 Pa\(^{-1}\) | Elevated; atherogenic conditions likely |
Combined Metric
RRT captures information from both TAWSS and OSI simultaneously. Regions with low TAWSS but unidirectional flow (low OSI) have only moderately elevated RRT. Regions with low TAWSS and high OSI yield the highest RRT values, identifying locations where both shear magnitude and oscillation are unfavourable.
Running the Exercise
Step 1: Extract the Pre-Computed Results
The archive contains pre-computed pulsatile CFD results on the G3 synthetic aorta geometry (a parametric coarctation model with one inlet and four outlets). The time-resolved WSS fields are stored for one complete cardiac cycle.
Step 2: Compute Hemodynamic Metrics
This script reads the pre-computed WSS fields, integrates over the cardiac cycle, and produces:
qoi_summary.json--- structured quantities of interest with metadataqoi_summary.csv--- flat tabular format for spreadsheet analysis- Console output summarising all hemodynamic metrics
Step 3: Read the Output
The console output displays a table of the form:
=== Hemodynamic Summary (G3 Synthetic Aorta) ===

  Pressure drop (mean):     12.4 mmHg
  TAWSS mean:                2.1 Pa
  TAWSS P95:                 5.8 Pa
  TAWSS P99:                 8.3 Pa
  OSI mean (masked):         0.14
  RRT mean:                  3.2 Pa^-1
Why Percentiles, Not Maximum
The maximum WSS value on a computational mesh is highly sensitive to mesh topology artefacts at refinement boundaries and corner cells. It does not converge reliably with mesh refinement Valen-Sendstad 2014. AortaCFD reports P95 and P99 percentiles, which provide robust statistical summaries with convergent behaviour. Always report P95 or P99 rather than the absolute maximum in publications.
Interpreting Results for the G3 Geometry
The G3 synthetic aorta includes a coarctation (localised narrowing) in the descending segment. The hemodynamic consequences of this geometry produce characteristic spatial patterns:
Regions of High WSS
- Coarctation throat: Flow acceleration through the narrowing produces a high-velocity jet. WSS at the coarctation site is elevated (typically 5--10 Pa), reflecting the steep near-wall velocity gradients.
- Jet impingement zone: Immediately downstream of the coarctation, the jet impinges on the outer wall, creating a localised high-WSS patch.
Regions of Low WSS and High OSI
- Post-coarctation recirculation: The jet separates from the wall downstream of the narrowing, creating a recirculation zone on the inner wall. This region exhibits low TAWSS (< 0.4 Pa) and elevated OSI (> 0.2), indicating disturbed, multidirectional flow.
- Branch flow separation: At the supra-aortic branch ostia, flow separation creates pockets of low and oscillatory shear.
Clinical Interpretation
In a real patient with aortic coarctation, the post-coarctation recirculation zone would be considered at elevated atherogenic risk. The combination of low TAWSS and high OSI produces elevated RRT, indicating prolonged particle residence near the wall. This hemodynamic environment is precisely what promotes lipid accumulation and inflammatory cell adhesion.
Pressure Drop
Definition
The pressure drop is the cycle-averaged difference between the inlet and outlet mean pressures:
AortaCFD reports this value in both Pa and mmHg (1 mmHg = 133.322 Pa).
Clinical Significance for Coarctation
The trans-coarctation pressure gradient is the primary clinical metric for assessing coarctation severity. The 2014 ESC guidelines Erbel 2014 specify that a peak systolic gradient exceeding 20 mmHg at rest is an indication for intervention, provided there is concurrent evidence of anatomical significance (imaging confirmation of narrowing).
| Pressure Drop | Clinical Interpretation |
|---|---|
| < 10 mmHg | Normal haemodynamics at rest |
| 10--20 mmHg | Mild gradient; clinical monitoring indicated |
| > 20 mmHg at rest | Exceeds intervention threshold (ESC guidelines) |
Most Robust Metric
Pressure drop is the most mesh-independent hemodynamic metric. It converges at coarser mesh resolutions than wall shear stress because it depends on the global momentum balance rather than the near-wall velocity gradient. When mesh convergence is uncertain, pressure drop provides the most reliable quantitative comparison.
Output Files
qoi_summary.json
The JSON output contains structured hemodynamic data with metadata:
{
  "case_id": "G3",
  "cardiac_period_s": 0.5,
  "pressure_drop_mean_mmhg": 12.4,
  "tawss_mean_pa": 2.1,
  "tawss_p95_pa": 5.8,
  "tawss_p99_pa": 8.3,
  "osi_mean_masked": 0.14,
  "rrt_mean": 3.2
}
This file is designed for programmatic consumption (Python, MATLAB, R) and should be included as supplementary material in publications for reproducibility.
qoi_summary.csv
The CSV file provides a flat tabular format suitable for direct import into spreadsheet software or statistical analysis tools. When processing multiple cases via batch execution, individual CSV files can be aggregated into a cohort comparison table.
Using QoI Values in Publications
When reporting hemodynamic metrics in a manuscript:
- Report P95 or P99 for TAWSS, not the maximum value.
- Report masked mean OSI to exclude numerically unreliable regions.
- Report pressure drop in mmHg for clinical relevance.
- Include the
qoi_summary.jsonas supplementary material. - State the mesh resolution, numerics profile, and number of cardiac cycles analysed.
Exercise: Hemodynamic Analysis
- Extract and run the exercise as described above.
- Examine the output: does the mean TAWSS fall within the normal range (1--3 Pa)?
- Is the pressure drop above or below the 20 mmHg intervention threshold?
- Where would you expect to find the lowest TAWSS values on the G3 geometry?
- If this were a real patient, what clinical recommendation would the hemodynamic data support?
Discussion
How do the spatial distributions of TAWSS, OSI, and RRT relate to each other? Do regions of low TAWSS correspond to regions of high OSI and elevated RRT? What does this co-localisation imply about atherogenic risk in this geometry?
What's Next
Tutorial 5 applies the complete AortaCFD pipeline to a real patient-specific aortic geometry, including pulsatile inlet conditions, Windkessel outlets, and full hemodynamic analysis.
References
Full bibliography on the References page.
Found an issue or have a suggestion for this page?
Open a GitHub issue